|
Report from
North America
Rising coronavirus cases stall economic recovery
Given the reporting lag for most traditional economic
indicators, investors have turned to real-time data to assess
the economy during the pandemic, almost all of which
now show business activity stalling or declining.
Economists at investment firm Jefferies wrote in a note to
clients that their in-house economic activity index has
"flat-lined" and "has now been moving sideways for the
past three weeks."
Many of the southern states that are experiencing a
significant surge in coronavirus infections after lifting
lockdown restrictions, unlike the regions in the north that
were hit hard in March and April, according to White
House coronavirus task force coordinator Deborah Birx.
Coronavirus deaths are increasing in the newˇŻ hotspotsˇŻ of
Florida, Texas and Arizona even as they continue to trend
down nationally.
Regional data show particular economic weakness in
virus-hit states, where V-shaped recoveries are stalling.
Given the timing of the hit, official June data are likely to
be spared, but there is clear downside for July data.
See:
https://www.axios.com/coronavirus-surge-economicrecovery-stalls-ea0303a4-81d0-47ed-94e3-def1d3884ec9.html
Falling sawnwood supply and higher demand is
affecting businesses
A shortage of sawnwood is affecting the construction
industry in what is usually its busiest time of the year.
According to Woodworking Network big construction
companies and smaller contractors are feeling the supply
crunch. The pandemic caused a big decline in supply as
well as an increase in demand likely spurred by
homeowners opting to renovate while they were stuck at
home.
Many of North AmericaˇŻs biggest sawnwood producers
significantly lowered output during the pandemic while
laying off hundreds of employees. Sawnwood prices have
been rising for two months in a row.
See:
https://www.woodworkingnetwork.com/news/woodworkingindustry-news/lumber-big-sales-and-depleting-supply-affectingconstruction
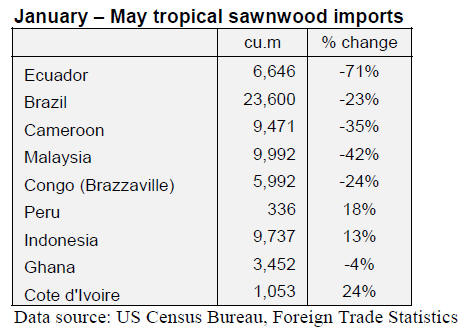
Tropical hardwood imports fell in May
After a promising April, US imports of sawn tropical
hardwood fell by 39% in May, back to the level seen in
March.
At 39,020 cubic metres, the volume of May tropical
hardwood imports was down more than 45% from the
previous May. Year-to-date imports are down 39%.
Imports from Indonesia were down by 55% in May but
remain ahead 26% year-to-date. Imports from Brazil fell
by 21% and imports from Cameroon were off 35%.
Imports from Ecuador bounced back somewhat in May,
rising 49%, but still trail 2019 year-to-date by 73%.
Imports of jatoba, sapelli, virola and ip¨¦ all fell sharply in
May. Year to date, virola is outpacing last year by 7%
while imports of jatoba are down 29%, spelli is down
18%, and ip¨¦ is down 30%. Balsa is down a full 73% yearto-
date, despite gaining by 56% in May.
Canadian imports of tropical hardwood rose 78% in May
but were still nearly 10% lower than that of May 2019.
Imports are down 6% year-to-date.
Hardwood plywood imports advance
US imports of hardwood plywood grew by 21% in May.
Imports from Malaysia quadrupled from April to record
the highest volume since May of 2010. Imports from
Indonesia were also up sharply and are ahead year-to-date
by 47%.
Imports from Russia and Vietnam grew slightly in May
and are ahead by 32% and 43%, respectively, year-to-date.
Total US hardwood plywood imports are up 13% year-todate
through May.
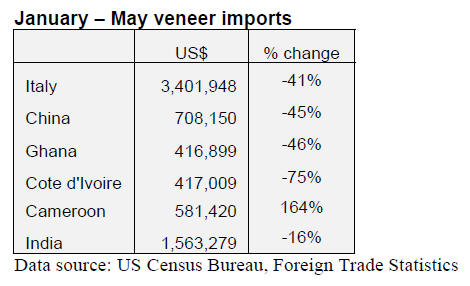
Veneer imports crash
Imports of tropical hardwood veneer were down sharply in
May, falling 44%. After a promising gain in April,
imports now lag behind 2019 year-to-date totals by 33%.
Imports from Italy, China, Ghana and Cote dˇŻIvoire were
all down in April and are all off by more than 40% yearto-
date.
Despite falling to the lowest monthly total in two years,
imports of veneer from India are down only 7% year-todate.
The only trade partner doing better this year than last
is Cameroon, which is ahead by 128% year-to-date.
Hardwood flooring imports stay down while flooring
panel demand rebounds
US imports of hardwood flooring continued their recent
slide, falling by 3% in May. While totals were relatively
flat for the month, imports from China and Malaysia
gained back some of the market they had lost to Indonesia
in recent months.
Imports from China and Malaysia were up 51% and 90%
in May, while imports from Indonesia were down by 72%.
Still, year-to-date imports from China are down 58% and
imports from Malaysia trail by 67%, while imports from
Indonesia are up by 13% through May.
Imports of assembled flooring panels grew by 20% in May
but were still at a level nearly 30% down from May 2019.
While imports from China, Canada and Vietnam all rose
sharply, their standing versus last year varues widely.
Imports from China are barely half that of 2019 year-todate,
imports from Canada are even with last year, and
imports from Vietnam are up 10% through May.
Moulding imports from China return to 2019 level
Imports of hardwood mouldings held steady in May,
falling a mere 2% from the previous month. But, much
like flooring, the sources of trade varied much more.
Imports from China rose 52% to the highest level since
September and slightly above May 2019. ChinaˇŻs gain
was offset by sharp declines in imports from Malaysia
(down 80%) and Brazil (down 43%). Year-to-date
imports are behind 16% through May and are down this
year for all major trading partners.
Cabinet sales see major improvement
Cabinet manufacturers reported a decline in overall
cabinet sales of 1.8% for June 2020 compared to the same
month in 2019 according to the Kitchen Cabinet
Manufacturers AssociationˇŻs (KCMA) monthly Trend of
Business Survey of participating manufacturers.
Custom sales were down slightly, semi-custom sales
dropped 11%, and stock sales increased over 4%. Survey
participants include stock, semi-custom, and custom
companies whose combined sales represent approximately
three quarters of the US kitchen cabinet and bath vanity
market.
Despite the drop, this is a major improvement over the
initial months of the pandemic with sales rising 24% in
June 2020 compared to May. Custom sales increased 18%;
semi-custom sales increased 21%; and stock sales
increased 28% compared to the previous month.
It was in April that the damage caused by COVID was
observed as sales fell 22% over April 2019. Sales had also
dropped 31% in March.
Residential furniture orders recover
New residential furniture orders in May were up 166%
over April according to the latest Smith Leonard survey of
manufacturers and distributors. Somewhat of a surprise
was that 19% of the participants recorded an increase in
May orders over May 2019. New orders in May 2020 were
down 8% from May 2019 after a 61% decline reported in
April.
The May, April, and March results offset the fairly good
results of January and February, resulting in a decline in
year-to-date orders of 18%.
In May, shipments were down 31% after a 50% decline
reported for April. The lower shipment numbers were
expected as a result of the decline in orders the last three
months. A few participants reported increased shipments
over May 2019. Year to date shipments were down 18%.
See:
https://www.smith-leonard.com/2020/07/29/july-2020-furniture-insights/
|