Japan Wood Products Prices
ˇˇ15¨C 30th April
2019
Japan
Wood Products Prices
Dollar Exchange Rates of 25th
April
2019
Japan Yen 111.63
Reports From Japan
10 day public holiday to boost consumer spending
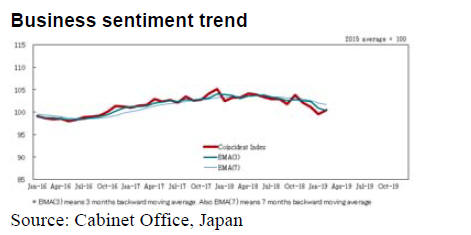
Sentiment among Japan's largest manufacturers became
more pessimistic in the first quarter of 2019 as reported by
the Bank of Japan's (BoJ) business survey, the ˇ®Tankan
reportˇŻ.
Of the 10,000 companies surveyed most see the slowdown
in Chinese imports as a risk to businesses in Japan. The
likely rise in crude oil prices is also an issue as this would
push up production and distribution costs. A BoJ official
pointed to weaker demand in Asian markets including
China as having a negative impact on business sentiment.
If the trade talks between the US and China are concluded
quickly then this would greatly ease the concerns of
Japanese businesses.
On the bright side, Japanese people are in a festive mood
as they prepare for an unprecedented 10-day holiday to
celebrate the enthronement of a new Emperor.
This long holiday is expected to give the sluggish
economy a short-term boost. Breweries, hotels, retailers,
restaurants and train/airline operators are all expected to
benefit from the holiday which runs from April 27 to May
6. Banks, schools, government offices and many
businesses (including ITTOˇŻs HQ in Yokohama) will be
closed.
Will they or will they not?
The government was quick to dispel the suggestion from a
close aide to the Prime Minister that a delay in the
consumption tax rise could be considered if business
sentiment continues to weaken.
A government spokesperson reiterated that the
consumption tax will be raised to 10% from the current
8% ˇ°unless Japan's economy suffers a shock on the scale
of the global financial crisisˇ±.
A 10% tax is far too low according to the Organisation for
Economic Cooperation and Development (OECD). In its
biennial report, the OECD said the combined impact of a
rapidly aging population and the huge government debt
requires a "comprehensive fiscal consolidation plan,
including specific spending cuts and tax increases."
According to the Ministry of Finance JapanˇŻs public debt
is equivalent to more than 230% of GDP.
Fiscal normalisation dismissed for now
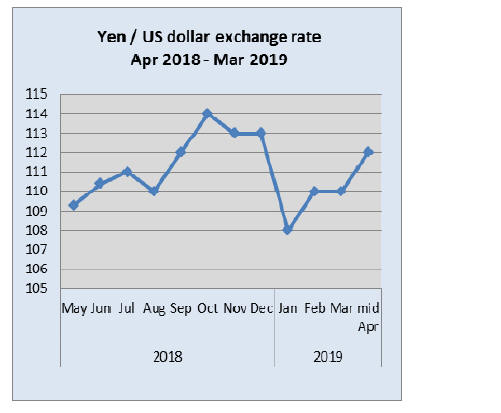
In late April the BoJ announced it plans to hold interest
rates at the current low level for an extended period which
analysts read as indicating no rise in interest rates for the
next 12 months. This decision was expected and had an
impact on the Yen/US dollar exchange rates.
At an international level, the collapse of the Swedish
krona to its lowest level in a decade highlighted a common
concern in financial markets, namely the stance of central
banks around the world.
SwedenˇŻs central bank has now joined many others such
as the BoJ and the Bank of Canada in dismissing prospects
of fiscal normalisation because of concerns on slowing
international trade and prospects for growth.
Zero-energy housing by 2030
Japan aims to achieve zero-energy status for all housing by
2030 through having new home owners install solar power
and other energy-saving features. This is part of the
government strategy to achieve its commitments to Paris
Agreement, the international framework to combat global
warming.
It is also proposed that energy balanced status will be the
aim for existing houses through renovations and subsidies.
See:
http://the-japan-news.com/news/article/0005690517
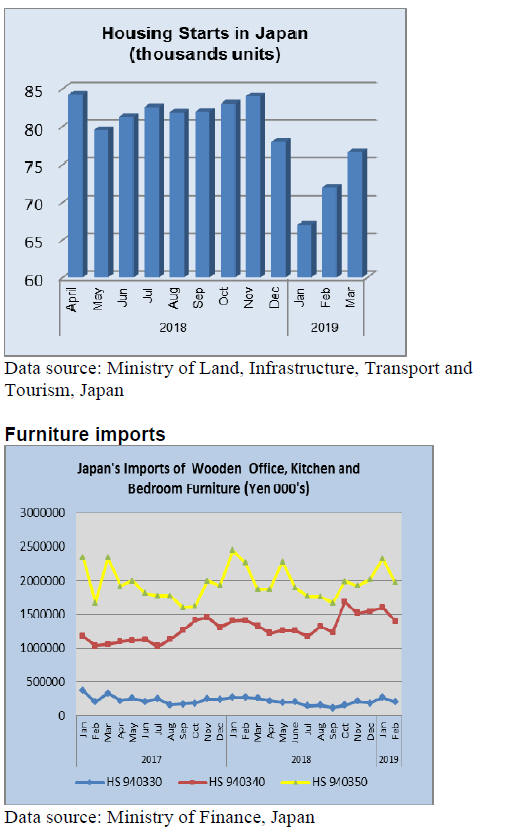
JapanˇŻs March 2019 housing starts were 10% higher than
in last March and month on month starts were 6.5%
higher. The good figures for March mark the third straight
rise in starts this year. However, total starts in the firs
quarter of 2019 were unchanged from levels in the first
quarter 2018.
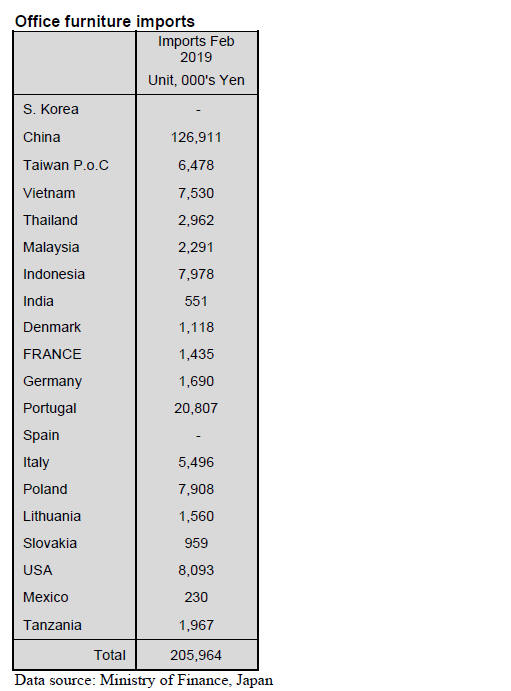
Office furniture imports (HS 940330)
In February the top two shippers of wooden office
furniture (HS940330) to Japan accounted for over 70% of
all HS940330 arrivals. China alone contributed around
60% with another 10% shipped from Portugal. Four other
shippers made it into the top 10 list namely US, Viet Nam
Indonesia and Poland with each contributing around 4% of
February 2019 imports.
Year on year the value of JapanˇŻs February 2019 imports
of wooden office furniture (HS 940330) were, once again
little changed but month on month imports dropped 24%.
This decline mirrors the pattern of trade over the past three
years and if this pattern is maintained there a rise will be
observed in March imports.
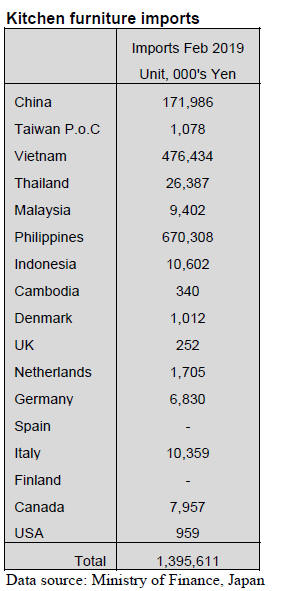
Kitchen furniture imports (HS 940340)
February data for the value of JapanˇŻs wooden kitchen
furniture imports (HS940340) reaffirmed the dominance
of the top two shippers, the Philippines and Vietnam
which together accounted for over 90% of JapanˇŻs wooden
kitchen furniture imports.
The third largest shipper, China, saw its share of February
imports drop to 12% from 14% in January.
Year on year the value of February 2019 imports of
wooden kitchen furniture rose 35% but month on month
there was a 14% decline.
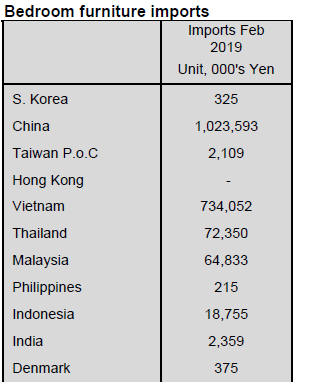
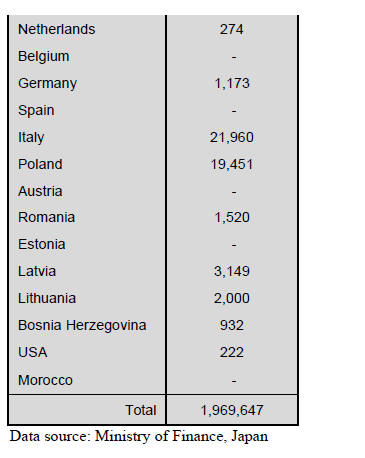
Bedroom furniture imports (HS 940350)
The continuously rising value of JapanˇŻs imports of
wooden bedroom furniture which began in in the third
quarter of 2018 and extended to January this year came to
an end in February when the value of imports dropped
15% compared to January. However, year on year the
value of imports for this category of furniture was up 16%
in February.
In February there was an over 30% drop in the value of
wooden bedroom furniture from China, imports from Viet
Nam were little changed from a month earlier but imports
from Thailand and Malaysia rose (8% and 26%
respectively).
Trade news from the Japan Lumber Reports (JLR)
The Japan Lumber Reports (JLR), a subscription trade
journal published every two weeks in English, is
generously allowing the ITTO Tropical Timber Market
Report to reproduce news on the Japanese market
precisely as it appears in the JLR.
For the JLR report please see:
http://www.n-mokuzai.com/modules/general/index.php?id=7
Wood based public buildings increase
The Ministry of Land, Infrastructure and Transport and the
Ministry of Agriculture, Forestry and Fisheries announced
that percentage of wood based public buildings less than
three stories built in fiscal year 2017 is 63 %. This is the
first time that percentage exceeded 60%.
However, many buildings are small so that floor space did
not increase as much as number of unit then buildings with
wood interior finish are 171 units, 9.5% less than 2016 so
wood use decreased by 14.9% with 3,139 cbms. This
move is based on the law to promote using wood for
public buildings in 2010 and in particular, lower buildings
of less than three stories are object of wood use.
In 2018, public buildings of less than three stories are 127
units, 30.9% more than 2016 with total floor space of
14,293 square meters, 3.5% more. In these, wooden
buildings are 80 units, 90.5% more with floor space of
9,457square metres, 29.9% more.
By type of building, bicycle parking is the top with18 units
with floor space of 509 square meters. Second is 10 units
of warehouse and parking garage with floor space of 652
square metres.
Third is eight rest areas along highways with floor space
of 1,570 square meters.
Others with large floor space are four office buildings with
floor space of 1,441 square metres, two lodgings with
floor space of 1,042 square metres. Other types are park
facilities, exhibition facilities, social welfare facilities and
toilets.
Used wood for public buildings in 2014 was 2,705 cbms,
in 2015 was 2,327 cbms, in 2016 was 3,689 cbms and in
2017 was 3,139 cbms.
By Ministry, Ministry of Defense put up 64 buildings,
Ministry of Land, Infrastructure and Transport built 23
units, Supreme Court built 17 units, Justice Ministry built
15 units. By the prefectures, Akita is the highest with
50.5%. Akita is the highest for last four years with more
than 50% share. 34 prefectures increased wood based
share in 2018.
Besides public buildings, the statistics include privately
built buildings such as educational facilities and medical
and welfare facilities, which have high public nature. Six
prefectures of Aomori, Akita, Yamagata, Gunma, Shimane
and Miyazaki have maintained high share of wood
buildings with more than 22% since 2010.
Compared to these prefectures, large populated prefectures
like Tokyo, Osaka, Kanagawa, Chiba and Aichi have
much tighter fire control restrictions, which make it hard
to use wood.
Law of wood use promotion for public buildings was
enacted in 2010 so share of wooden buildings is getting
larger.
February plywood supply
Total plywood supply in February was 489,800 cbms,
0.1% more than February last year and 5.0% less than
January. This is the first time that the supply dipped below
500,000 cbms. Domestic production continued active but
the imported plywood supply declined.
Softwood plywood production in February was 252,800
cbms, 4.1% more and 2.2% more. In this non-structural
plywood production was 21,700 cbms, 21.8% more and
11.5% more. This is to replace declining imported
hardwood plywood for flooring.
The shipment of softwood plywood was 252,600 cbms,
6.1% more and 6.9% less in which shipment of nonstructural
plywood was 22,600 cbms, 26.7% more and
17.3% more.
Demand for structural plywood by precutting companies
was busy and for non-structural panel was also active so
that the production and shipment are balanced. The
inventories were 117,100 cbms, 2,900 cbms more than
January.
The inventories increase some but the manufacturersˇŻ
inventories are low so that they intend to build up some
more before lengthy holidays in late April and early May.
Imported plywood by source was 86,500 cbms from
Malaysia, 0.9% more and 7.2% less, 83,200 cbms from
Indonesia, 5.8% more and 8.8% more but total import for
January and February from Malaysia was down by 5% and
Indonesia was down by 4%.
Because of escalating export prices and weak demand in
Japan, the importers are not so anxious to commit future
volume.
Plywood market is deadlocked. Demand for domestic
softwood plywood is steady by precutting plants but
wholesale channel is dull and some low offers are going
around. Imported plywood is weak in demand but high
priced cargoes keep arriving so price reduction is
impossible.
Movement of softwood plywood varies by the regions. In
Western Japan, supply tightness is easing but active
movement continues in Kyushu and Osaka region.
Plywood manufacturers in Western Japan carry
limited inventory and experience shortage of delivery
trucks.
Meantime, in Eastern Japan, movement is stagnating. Dull
movement of wholesale channels and some of inventory
disposals by trading firms for book closing in March
soften market.
Imported plywood market is confusing as the demand in
Japan continues weak while bullishness of
suppliers continues, which insist on selling cost base
prices.
Some suppliers switch to container from bulk carriers,
which plugs up port warehouses so warehouse companies
are increasing handling charge, which is another cost up
factor. The market prices are weak by soft demand
Wood panel review 2018
Total supply of wood panels (plywood and wooden board)
in 2018 was 9,144,495 cbms, 0.2% more than 2017.
In this, domestic panels were 5,064,623 cbms, 0.6% less.
Imported panels were 4,079,872 cbms, 1.3% more. Share
of domestic and import was 55.4% vs 44.6%. Domestic
supply of wooden board decreased by 37,031 cbms while
that of import increased by 33,565 cbms. Decrease of
domestic supply was mainly particleboard and MDF.
New housing starts in 2018 were 942,370 units, 2.3% less
than 2017 with wood based units of 539,394 units, 1.1%
less. Problems wood panel supply faced in 2018 were
manpower shortage and logistics such as lack of long haul
trucks.
For plywood, one new mill started in April by Nisshin so
total supply should have increased but total production of
domestic plywood increased only by 0.2%. Reasons are
tightening of labor standard law and shortage of young
workers, particularly in local regions.
To secure young workers, working rules are changing to
reduce overtime works. Plywood mills had been running
over the weekend and late hours when orders are heavy
but now such extra works are largely reduced so that the
production does not increase.
Logistic problems are getting serious year after year.
Many wood panel manufacturers have plant in local
regions and it is necessary to transport products to large
consuming markets like Tokyo and Osaka but securing
long haul trucks is getting harder and harder. For imported
panels, as containers shipment becomes standard after the
volume for Japan drops, the suppliers switched from bulk
ships to containers.
Warehouses at ports are plugged up with incoming
cargoes and handlings are delaying. Transporting
products from manufacturing plants to the markets is a
problem but transporting raw materials like logs and wood
chip to manufacturing plants poses the same problem.
The market of wood panels in 2018 stayed rather firm,
supported by active demand. Domestic softwood plywood
prices of 12 mm 3x6 have been held firm at 1,050 yen per
sheet delivered since March 2018. The manufacturers did
not reduce the prices even when the market softened
temporarily.
On imported plywood, the suppliers are determined to sell
based on actual cost so the export prices have been
climbing month after month and the Japanese buyers had
to accept high prices.
Total imported plywood in 2018 was 2,923,056 cbms,
0.7% more than 2017. By source, 1,062,086 cbms from
Malaysia, 10.8% less than 2017. 977,557 cbsm from
Indonesia, 11.4% more. 642,008 cbms from China, 1.9%
less. 241,405 cbms from other countries, 32.2% more.
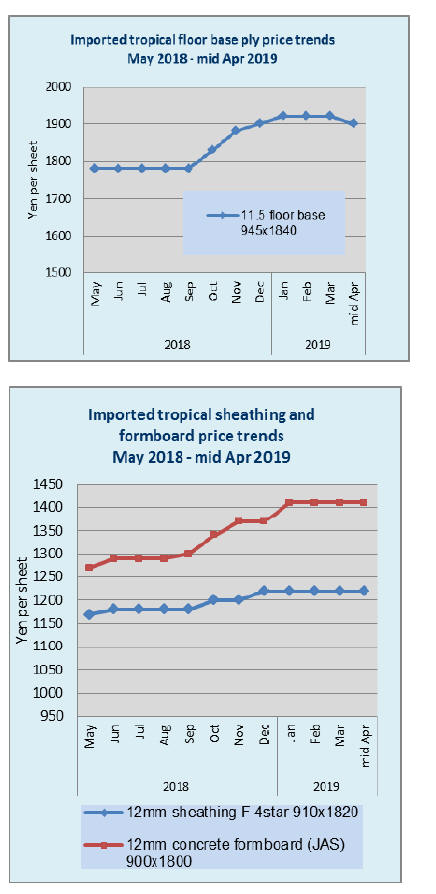
Export prices of uncoated concrete forming 3x6 panel
were $520-530 per cbm C&F and coated concrete forming
panel were $600 at the beginning of the year and the prices
climbed to $580-590 and $680-690 by the end of 2018.
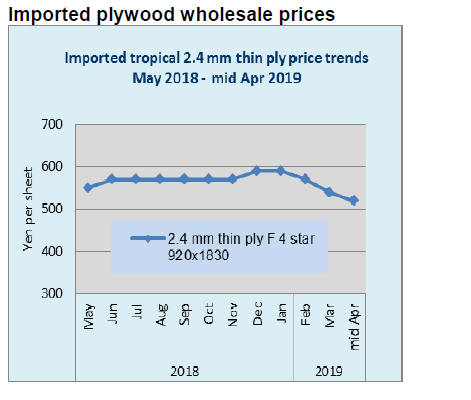
The increase was $50-90 in one year. Also Indonesian 2.4
mm thin panel prices climbed by $300 in six months to
$1,100.
Supply of wooden board (fiber board and chip board) in
2018 was 3,004,642 cbms, 0.1% less than 2017. Domestic
supply was 1,847,826 cbms, 2.0% less and imported
supply was 1,156,816 cbms, 3.0% more.
Despite housing starts in 2018 were down by about 20,000
units, the supply of wooden board did not drop. By item,
in early 2018, supply of 2x6 particleboard was tight but
the supply recovered in the second half. Thin MDF for
flooring continues tight but overall supply and demand
were balanced.
Domestic supply of particleboard was 1,075,019 cbms,
1.7% less. Imported particleboard was 541,935 cbms,
2.6% more. In this, OSB was 285,360 cbms, 1.7% more.
Total supply of MDF was 1,007,830 cbms, 0.2% more.
Domestic supply was 395,727 cbms, 4.5% less while
imported MDF was 612,103 cbms, 3.6% more.
Trend to switch floor base from tropical hardwood
plywood to MDF, domestic softwood plywood and
composite floor base made of planted species of falcate
continues.
Looking at the production of composite flooring,
combination of MDF and imported hardwood plywood
declined by 1.8% but combination of MDF and softwood
plywood increased by 2.9% so MDF demand for flooring
continues increasing. Also after the prices of thin plywood
from South East Asian countries have kept climbing,
demand for thin hardwood MDF increased.
OSB supply from North America increased some but the
supply from Europe declined as the demand in Europe was
active and the prices are more attractive and the freight
also increased, which discouraged supply for Japan.
|