|
Report from
North America
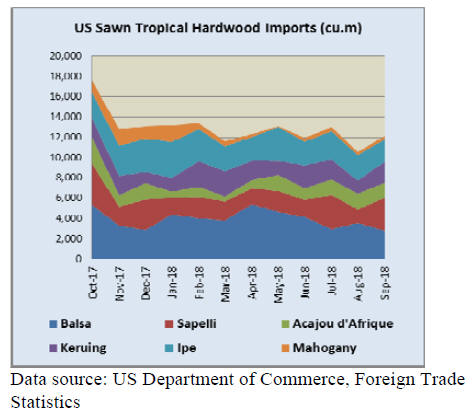
Tropical sawnwood imports hold steady in August
US imports of tropical sawn hardwood held steady in
September with imports up less than 1% from the previous
month at 16,611 cu.m.

However, because US imports historically drop by 5% to
20% from August to September, a flat month actually
improved the outlook for the year as September 2018
imports nearly matched the volume of September 2017.
Year-to-date, tropical hardwood imports are down 12%
compared with 2017. The overall decline in tropical
sawnwood year-to-date is mainly due to lower balsa,
sapelli and virola imports. Sapelli imports rebounded
strongly in September from a weak August but are still
21% down from 2017 year-to-date. Keruing imports grew
again in September and now surpass 2017 year-to-date
figures by nearly 50%.
Balsa imports declined by 22% in September and are
down nearly one-third versus 2017 year-to-date. Virola
and teak imports were down sharply in September and are
both falling further behind 2017 year-to-date figures.
Cedro, meranti and ip¨¦ imports all declined in September,
but remain ahead of their 2017 pace.
Unit values fell slightly for sapelli and acajou dˇŻAfrique
Ip¨¦ prices were up and teak continued its steady climb
back up, nearly returning to its level of one year ago after
a prolonged decline.
Canadian Sawnwood Imports Continue to Trail
Canadian imports of sawn tropical hardwood fell by nearly
a quarter in September as the Canadian market for tropical
imports continues to lag behind last year.
Total imports to Canada are down 18% year-to-date, with
sapelli, virola, ibuia and balsa all down by about one-third.
Imports of Mahogany rose sharply in September to move
ahead of last year-to-date by 7%. Imports of most other
tropical sawnwood fell sharply in September but are still
slightly ahead year-to-date from 2017.
Data source: Statistics Canada
US Consumer Confidence at 18-Year High
US consumer confidence rose in October to an 18-year
high amid optimism about jobs and the economy,
according to figures from the New York-based Conference
Board. The results, coming amid a rout in US stocks, bode
well for continued gains in consumer spending, which
accelerated in the third quarter to the best pace since 2014.
A solid job market is helping to support household
confidence as well as AmericansˇŻ purchases, which
account for about 70 percent of the economy.
The consumer confidence index rose to 137.9 from 135.3
in September and the present conditions measure advanced
to 172.8 from 169.4, both seeing their highest levels since
2000. The index measures consumersˇŻ assessment of
current economic conditions and their outlook for the next
six months.
Lynn Franco, Director of Economic Indicators at the
Conference Board, said in a statement that ˇ°consumers do
not foresee the economy losing steam anytime soon.
Rather, they expect the strong pace of growth to carry over
into early 2019.ˇ±
US GDP continued strong growth
The US economy grew at a faster-than-expected rate in the
third quarter as inflation was kept in check and consumer
spending surged, according to data released by the US
Commerce Department. Gross domestic product (GDP)
expanded by a 3.5% annual rate.
The department said the PCE price index, a key measure
of inflation, increased by 1.6% last quarter, much less than
the 2.2% increase expected by economists polled by
StreetAccount.
Consumer spending, which accounts for more than two
thirds of US economic activity, grew by 4% in the third
quarter, the strongest since the fourth quarter of 2014.
The strong rise in consumer spending helped offset a 7.9%
decline in business spending. That was the biggest
quarterly decline in business spending since the first
quarter of 2016.While stronger than expected, the overall
expansion was a slower pace of growth than in the
previous quarter.
Housing starts and home sales fall
Led by a drop in multifamily home building, total housing
starts fell 5.3% in September to a seasonally adjusted
annual rate of 1.2 million units, according to data from the
US Department of Housing and Urban Development and
the US Commerce Department.
According to the US Census Bureau and US Department
of Housing and Urban Development single-family starts
edged down 0.9% to 871,000 units. Meanwhile,
multifamily starts, which includes apartment buildings and
condos, fell 15.2% to 330,000. Regionally in September,
combined single-family and multifamily housing starts
rose 29% in the Northeast and 6.6% in the West. Starts fell
13.7% in the South and 14% in the Midwest.
Existing-home sales declined in September after a month
of stagnation in August, according to the National
Association of Realtors. All four major regions saw no
gain in sales activity in September.
Total existing-home sales fell 3.4% from August to a
seasonally adjusted rate of 5.15 million in September.
Sales are now down 4.1% from a year ago according to
data from the National Association of Realtors.
Sales of newly built, single-family homes fell to a
seasonally adjusted annual rate of 553,000 units after
downwardly revised August, July and June reports,
according to the US Department of Housing and Urban
Development and the US Census Bureau. This is the
lowest sales pace since December 2016. However, on a
year-to-date basis, sales are up 3.5 percent from this time
in 2017.
According to the Census BureauˇŻs Housing Vacancy
Survey, homeownership rates among all age groups under
64 increased over the last year. Millennial households,
mostly first-time homebuyers, registered the largest gains
among all households, with owners under age 35 showing
a 1.2 percentage point increase from a year ago to 36.8%.
Millennials are gradually returning to the for-sale housing
market, where gains in home price are slowing down. The
homeownership rates of households ages 45-54 and 55-64
experienced a 0.8 percentage point increase. The US
homeownership rate was 64.4% in the third quarter of
2018, which is not statistically different from its last
quarter reading.
|