|
Report from
Europe
EU tropical timber imports flat-line in 2018
The slowdown in EU imports of tropical products, which
began in 2016 and continued throughout last year, levelled
off in the first quarter of 2018.
Chart 1 shows twelve monthly rolling average imports (to
iron out seasonal fluctuations) into the EU of all tropical
wood products listed in HS Chapter 44 (excluding wood
waste and chips). It shows that imports peaked at an
average of 224,000 metric tonnes (MT) per month in
September 2016, slipped to a low of 207,000 MT in
January this year and recovered only slightly, to 209,000
MT, by March 2018 (Chart 1).
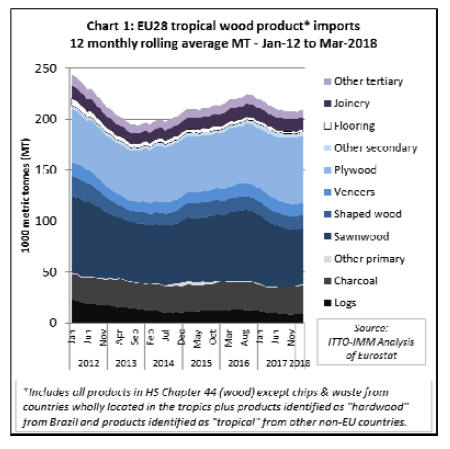
EU imports of tropical wood products in the first quarter
of 2018 were only around 7% more than the all-time low
of 195,000 MT per month recorded in the middle of 2013
at the height of the euro-zone crises.
In value terms, EU imports of tropical wood products
averaged around euro203 million per month in the first
quarter of 2018, 13% more than the all-time low in 2013
but 6% down on the level prevailing in 2016.
Most of the rise and subsequent slowdown in EU tropical
imports in the last three years was driven by sawnwood.
The stabilisation of the EUˇŻs tropical wood trade so far in
2018 is mainly due to a slight uptick in imports of
plywood and charcoal.
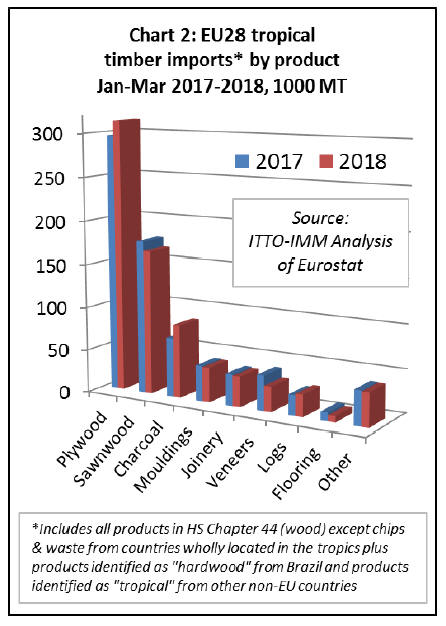
In the first quarter of 2018 compared to the same period in
2017, total EU imports of tropical wood products
increased 1% to 740,000 MT. There was a 23% rise in
imports of tropical charcoal to 85,000 MT, a 6% rise in
imports of tropical plywood to 314,000 MT, and 9% rise
in imports of other secondary products (such as fibreboard
and sleepers) to 14,000 MT.
However, these gains were largely offset by a 6% decline
in EU imports of tropical sawn to 166,000 MT, a 28%
decline in imports of tropical veneer to 29,000 MT, a 2%
fall in imports of tropical mouldings to 40,000 MT, and a
10% fall in imports of various tertiary products (such as
flooring, glulam and other joinery, marquetry, and wooden
tools) to 64,000 MT (Chart 2).
Recorded rise in UK tropical imports may be
misleading
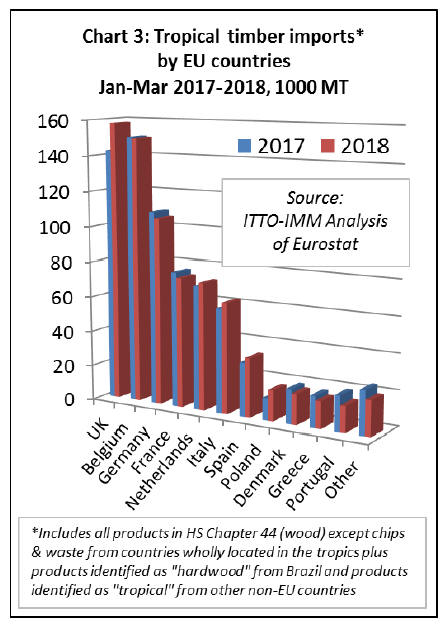
In the first quarter of 2018, imports of tropical wood
products appear to have been more buoyant in the UK than
other EU markets. UK imports were 158,000 MT during
the period, 11% more than the previous year.
However, this gain was almost all due to an apparent rise
in UK imports of hardwood plywood from Brazil. The
sharp increase recorded in Eurostat import statistics is not
matched by any significant increase in Brazilian export
statistics for hardwood plywood to the UK.
This may well be a statistical error (such as Elliottis pine
plywood being misidentified as hardwood).
Other EU markets reporting growth in tropical wood
imports the first quarter include the Netherlands (+3% to
72,300 MT), Italy (+6% 62,600 MT) and Spain (+10% to
33,300 MT). However, the fastest growth of all was in
Poland which registered an increase of 39% to 17,300 MT.
This was due almost entirely to a sharp rise in PolandˇŻs
imports of charcoal from Nigeria.
Imports of tropical wood products in Belgium were
150,000 MT in the first quarter of 2018, the same as in
2017. Imports in Germany and France slipped a little in
the first three months of 2018, down 3% and 4%
respectively compared to the same period last year. (Chart
3).
First quarter decline in EU imports of tropical
sawnwood
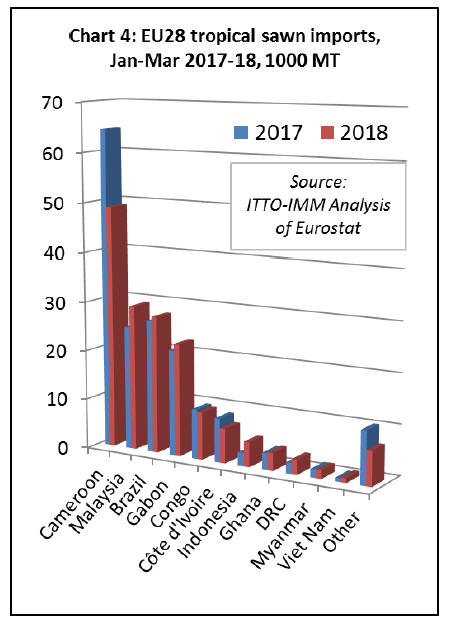
EU imports of tropical sawn wood decreased 6% to
166,100 MT in the first quarter of 2018. This was mainly
due to a continuing slide in imports from Cameroon, ongoing
since the end of 2016.
EU imports of tropical sawn wood from the central
African country declined a further 24% to 49,000 MT in
the first three months of 2017. Imports also fell from
Congo (down 4% to 9,400 MT), and Côte d'Ivoire (down
21% to 6,800 MT).
However, after a decline in 2017, EU imports of tropical
sawn wood from Malaysia increased 18% to 29,300 MT in
the first quarter of 2018. There was also a rise in imports
from Brazil (+3% to 27,600 MT), Gabon (+7% to 22,600
MT), and Ghana (+8% to 3,600 MT) and DRC _+36% to
3,000 MT). (Chart 4).
An 86% rise in EU imports of sawn wood from Indonesia
(to 5,000 MT), a country which restricts exports in this
product group to profiled wood, may be partly due to
reclassification of some wood mouldings products from
HS4409 to HS4407.
Introduction of the FLEGT licensing system in Indonesia
since November 2016 has led to some changes in the HS
codes used for Indonesian products by EU customs and
operators to ensure consistency between codes identified
on the licences issued in Indonesia and the codes entered
on to customs forms for entry into the EU.
In the first quarter of 2018, tropical sawn hardwood
imports declined 14% to 51,900 MT in Belgium, 9% to
18,600 MT in France, 30% to 10,700 tonnes in the UK,
11% to 6,800 MT in Germany, and 50% to 3,800 MT in
Portugal.
These losses were partially offset by a 33% rise to 35,200
MT in the Netherlands, a 22% rise to 17,800 MT in Italy
and a 6% rise to 12,600 MT in Spain.
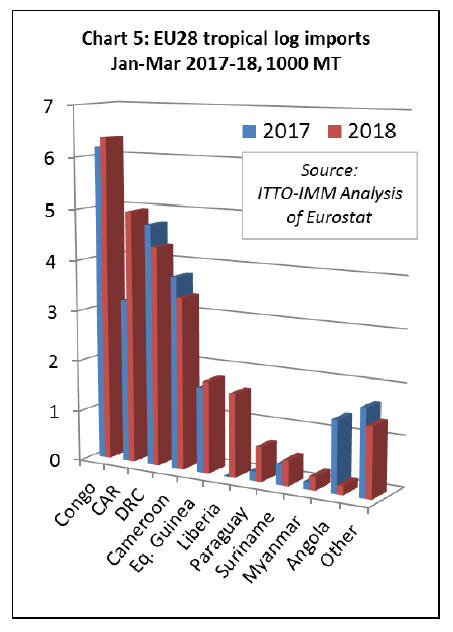
EU imports of tropical logs recover a little ground
After a downturn in 2017, EU imports of tropical logs
recovered a little ground at the start of 2018. Imports of
25,500 MT during the first quarter of the year were 9%
greater than the same period in 2017. EU imports of
tropical logs increased from the two leading suppliers,
Congo (rising 3% to 6,400 MT) and CAR (rising 54% to
5,000 MT).
EU log imports from Equatorial Guinea also increased
during the period, by 8% to 1,800 MT. Imports from
Liberia, of which there were none in the first quarter last
year, were 1,600 MT in the same period this year.
However, during the first quarter of 2018, EU imports of
tropical logs declined 9% from DRC to 4,300 MT and
11% from Cameroon to 3,400 MT. EU log imports from
Angola, which increased sharply in 2017, were again at
negligible levels in the first quarter of this year (Chart 5).
Most of the gain in EU imports of tropical logs in the first
quarter of 2018 was concentrated in France (+43% to
11,400 MT) and Belgium (+15% to 5,800 MT). Imports of
tropical logs in Portugal fell 32% to 3,800 MT during the
period.
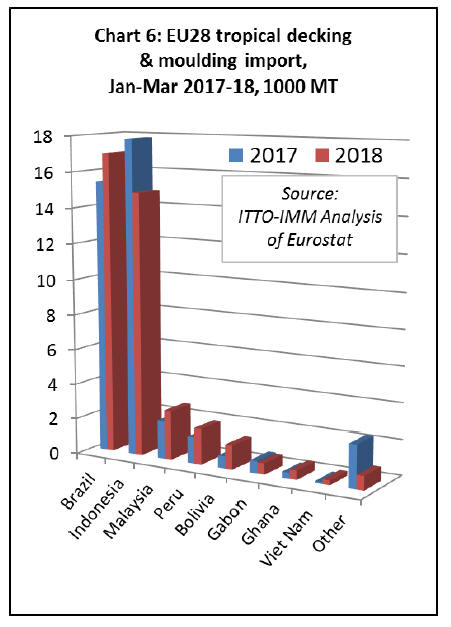
Stability in EU tropical decking imports
EU imports of tropical mouldings (which includes both
interior mouldings and exterior decking products) fell
slightly, by 2% to 40,200 MT in the first quarter of 2018.
A 10% rise in imports from Brazil to 17,000 MT offset a
17% decline in imports from Indonesia to 14,900 MT. As
noted earlier, the latter decline may be partly due to
alterations in the HS codes used to record imports from
Indonesia following introduction of FLEGT licensing.
EU imports of mouldings increased for some smaller
suppliers of this commodity in the first quarter of 2018
including Malaysia (+29% to 2,800 MT), Peru (+33% to
2,000 MT) and Bolivia (+100% to 1,400 MT) (Chart 6).
In the first quarter of 2018, imports of tropical decking
increased in France and Belgium but declined in Germany,
the Netherlands and the UK.
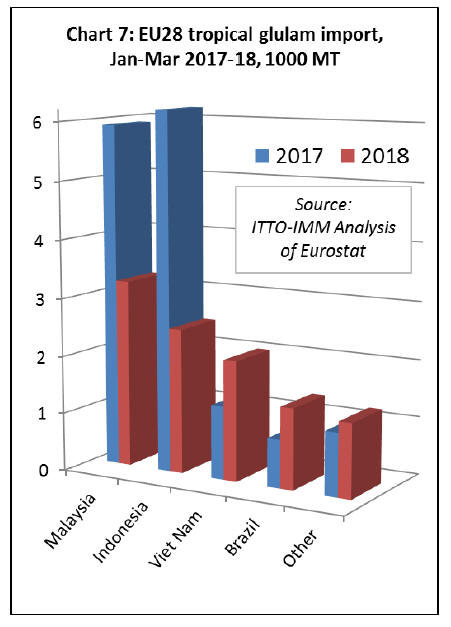
Sharp fall in EU imports of tropical glulam
EU imports of tropical glulam, mainly laminated window
scantlings, decreased 37% to 9,800 MT in the first quarter
of 2018. Imports decreased from both the leading
suppliers, falling 45% to 3,200 MT from Malaysia and
60% to 2,500 MT from Indonesia. (Chart 7).
Following introduction of FLEGT licensing in Indonesia,
a proportion of Indonesian products previously identified
as glulam (EU CN product code 44189010) is now being
classified as plywood (EU CN Code 4412) on EU customs
forms to ensure consistency with the FLEGT licenses
issued in Indonesia. Indonesia has no code comparable to
the EU code for ˇ°glulamˇ± in their national system to
classify products in trade.
In the first quarter of 2018 EU imports of tropical glulam
fell by 73% to 1,880 in the Netherlands, by 18% to 3,000
MT in Belgium, and by 38% to 1850 MT in Germany.
However, imports increased by 146% to 2,250 MT in
France.
Note that EU import data for the first quarter of 2018 for
tropical veneer, plywood, flooring, and wood furniture
will be included in the next market report.
European economic recovery loses momentum
During the first quarter of 2018, there was a loss of
momentum in the economic recovery that has been
underway in the EU since the start of 2017. The pace of
economic expansion in Germany was cut in half during the
period due mainly to weaker trade.
The 0.3% increase in GDP in EuropeˇŻs largest economy
was softer than forecast and the weakest in more than a
year. Dutch and Portuguese growth also cooled more than
expected in the first quarter, while a similar trend was seen
across central and eastern Europe.
Overall, euro-area growth was only 0.4% during the 3-
month period, well below expectations. It is unclear at this
stage whether the slowing rate of growth at the start of
2018 is merely a soft patch or indicative of something
more alarming.
So far, official forecasters have largely dismissed the
sluggish start to the year -- blaming factors such as colder
weather -- and expressed confidence that weakness will
dissipate.
The IMFˇŻs latest forecasts, published following the first
quarter results, suggest that growth in advanced European
economies, mainly the euro zone, would slow to 2.3% this
year from 2.4% in 2017 and then decelerate to 2.0 percent
in 2019.
The European Commission also downplayed concerns and
has maintained its forecast that full-year growth will
almost match the decade-high pace hit in 2017.
However, there are threats. The euro fell to six-month low
after the German GDP figures and other discouraging data
from the latest IHS Markit purchasing managersˇŻ surveys
which showed that forward looking indicators had also
deteriorated, suggesting no immediate bounce-back.
The IMF latest report highlights that European
governments have so far largely failed to use the breathing
space offered by improved economic conditions to push
forward with reforms needed to boost long-term growth.
Despite the recent growth, some of the biggest euro zone
economies like France, Italy or Spain have been slow to
further reduce their budget deficits towards a balanced
position while others, like Belgium, are increasing the
shortfall.
Concerns are also mounting in Europe about rising trade
protectionism, higher oil prices, the fallout from Brexit
scheduled for March next year, and the political situation
in Italy.
Of these issues, the last is potentially the most critical.
Economists calculate the cost of the promises made by
ItalyˇŻs newly installed government ¨C which include lower
taxes, higher benefits, and earlier retirement ¨C could reach
Euro170bn, or about 10% of ItalyˇŻs GDP. This would add
to the countryˇŻs Euro2.1trn debt mountain and potentially
trigger the EUˇŻs worst-case scenario: a Greek-style debt
crisis in the eurozoneˇŻs third-biggest economy.
There are also clouds on the horizon in the UK. One of
the UKˇŻs leading economic thinktanks has slashed its
forecasts for 2018 following evidence that growth almost
came to a halt in the first three months of the year.
The National Institute for Economic and Social Research
(NIESR) said it expected GDP expansion of 1.4% in 2018
¨C a sharp reduction from the 1.9% it had been predicting
three months ago. The revision followed publication of
official figures showing the UK economy grew by only
0.1% in the first three months of 2018 ¨C well below the
0.5% the think-tank had been forecasting.
As elsewhere in the EU, it is not clear if this is just a soft
patch or the start of a prolonged period of weakness. At
present, NIESR still expects UK to pick up to average
around 0.4% in each of the next three quarters.
The latest data on UK construction provides some little
reassurance. A pick-up in housebuilding helped the
building sector, which suffered from very poor levels of
activity in the first quarter, to bounce back in April.
However, overall demand for new buildings in the UK
remained subdued, according to the Markit/Cips UK
construction purchasing managersˇŻ index, with total new
work rising only modestly on the month. While
housebuilding bolstered growth in April, the picture was
less positive in other areas of construction, with
commercial building and civil engineering work rising
only marginally.
UK construction market analysts suggest that heightened
economic uncertainty, alongside lack of clarity on the
Brexit negotiations, is creating a risk-averse mood among
clients, leading to spending plans being delayed. Growth
in the UK construction sector is also likely to be
dampened by a planned 5.4% reduction in public sector
investment this year.
|