|
Report from
Europe
Slow-down in EU tropical timber imports
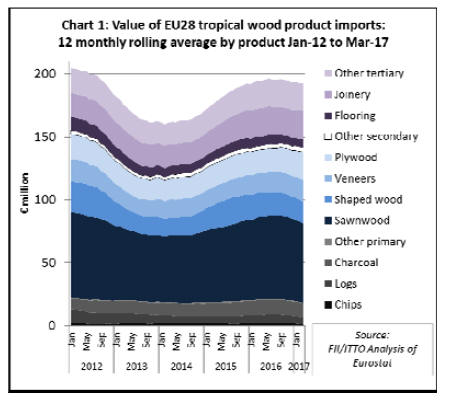
The slowdown in EU imports of tropical timber products
registered in the second half of 2016 continued into the
first quarter of 2017. Twelve monthly rolling average
imports, which peaked at just below €196 million in June
2016, had slipped to €193 million by March 2017.
Most of the rise and subsequent slowdown in EU tropical
imports in the 24 months prior to 2017 was driven by sawn
wood. Imports of other product groups remained relatively
more stable during this period (Chart 1).
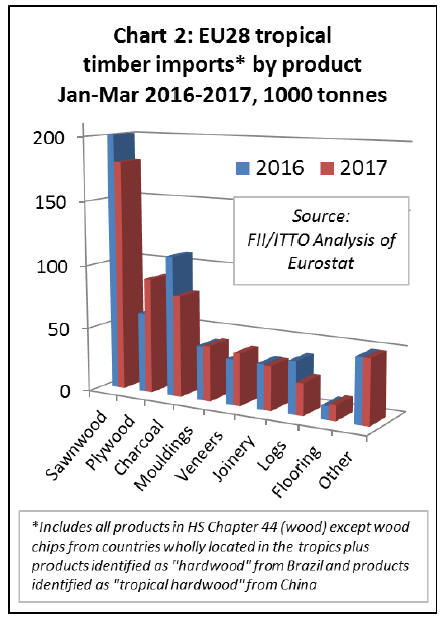
In the first quarter of 2017 compared to the same period in
2016, total EU imports of tropical timber products (all
those listed in HS Chapter 44) declined 5% to 553,000
metric tonnes (MT).
There was a 10% decline in EU imports of tropical sawn
to 180,000 MT, a 28% decline in imports of tropical
charcoal to 79,000 MT, and a 39% fall in imports of
tropical logs to 25,000 MT.
These losses were partially offset by a 45% rise in imports
of tropical plywood to 90,000 MT, a 2% rise in imports of
tropical mouldings (including decking) to 43,000 MT, a
15% rise in imports of tropical veneers to 40,000 MT, and
a 16% rise in imports of tropical flooring to 12,000 MT
(Chart 2).
Tropical timber imports down in nearly all EU markets
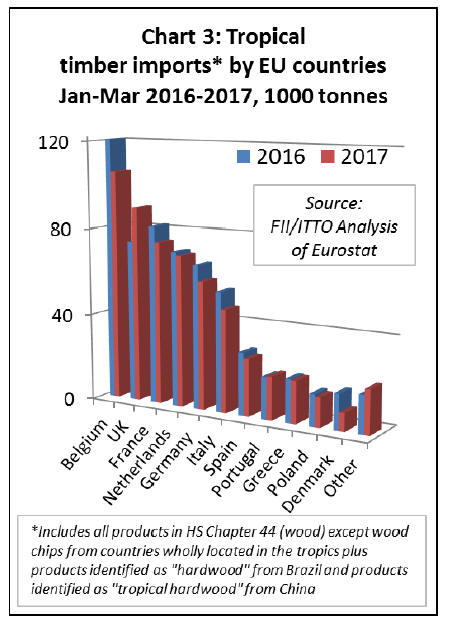
After rising strongly in 2016, imports of tropical timber
products in Belgium declined 12% to 106,000 MT in the
first quarter of 2017. Imports of tropical timber products
into France, Germany and Italy, which have been slipping
in recent years, also had a slow start to 2017.
In the first quarter, imports declined 8% to 75,000 MT into
France, 11% to 59,000 MT into Germany and 14% to
47,000 MT into Italy.
After showing signs of recovery last year, imports of
tropical timber products into the Netherlands and Spain
weakened again in the first quarter of 2017. During the
period, imports fell 2% to 70,000 MT into the Netherlands
and 9% to 26,000 MT into Spain. (Chart 3).
The UK was the only large EU market for tropical timber
products registering an increase in imports in the first
quarter of 2017. UK imports increased 21% to 90,000 MT
during the period, although a significant part of this gain
was due to a rise in imports of tropical-hardwood-faced
plywood from China rather than an increase in direct
imports from the tropics.
10% decline in EU imports of tropical sawn wood
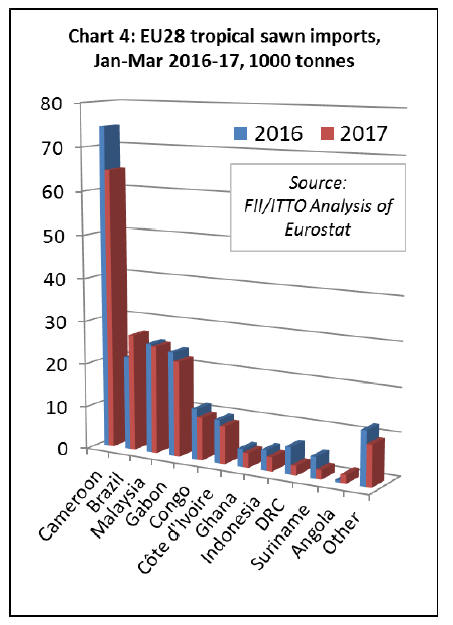
EU imports of tropical sawn wood decreased by 10% to
180,000 MT in the first quarter of 2017. After a significant
rise in trade with Cameroon last year, EU imports of
tropical sawn wood from the central African country
declined 13% to 64,700 MT in the first three months of
2017.
Imports also fell from Malaysia (down 2% to 24,900 MT),
Gabon (down 8% to 22,100 MT), Congo (down 16% to
9,900 MT), Côte d'Ivoire (down 13% to 8,800 MT), Ghana
(down 18% to 3,400 MT), DRC (down 64% to 2,200 MT)
and Suriname (down 57% to 2,100 MT).
However, after a decline in 2016, EU imports of tropical
sawn wood from Brazil increased 25% to 27,000 MT in
the first quarter of 2017. Imports from Angola, which were
negligible in 2016, increased to 2,000 MT during the
period (Chart 4).
In the first quarter of 2017, tropical sawn hardwood
imports declined 15% to 62,100 MT into Belgium, 14% to
20,900 tonnes into France, 37% to 14,600 tonnes into
Italy, 21% to 10,400 MT into Spain, and 9% to 7,100 MT
into Germany. These losses were partially offset by a 10%
rise to 14,600 MT into the UK and a 33% rise to 8,100 MT
into Portugal.
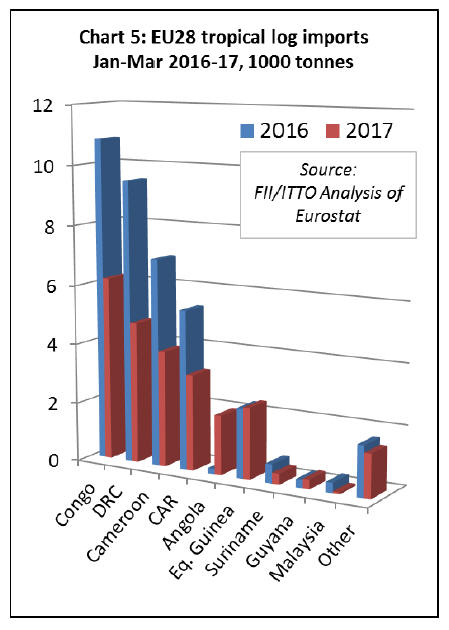
Downward trend in EU imports of tropical logs
After a brief recovery in 2015 and stasis in 2016, the
downward trend in EU imports of tropical logs resumed in
the first quarter of 2017. Imports were only 24,700 MT,
35% less than the same period in 2016.
EU imports of tropical logs decreased from all the leading
suppliers including Congo (down 43% to 6,200 MT), DRC
(down 50% to 4,750 MT), Cameroon (down 44% to 3,900
MT) and CAR (down 40% to 3,200 MT).
Imports from Equatorial Guinea were level during the
period at 2,400 MT and imports from Angola increased
from negligible levels to 2,000 MT. (Chart 5).
Most of the decline in EU imports of tropical logs in the
first quarter of 2017 was concentrated in France, Belgium
and Italy. Imports of tropical logs into Portugal were
stable during the period.
Stability in EU tropical decking imports
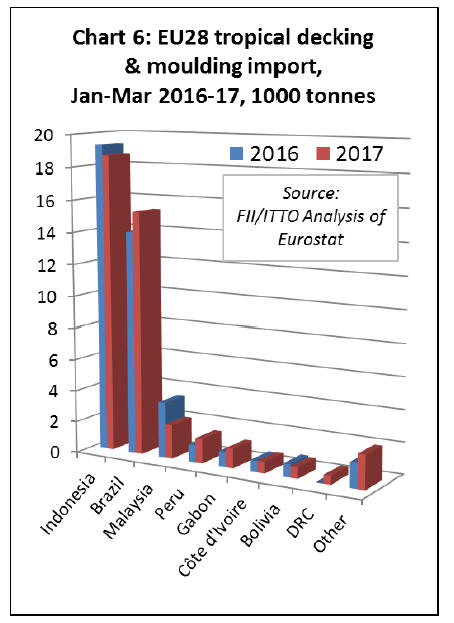
EU imports of tropical mouldings (which includes both
interior mouldings and exterior decking products)
increased 2% to 43,000 MT in the first quarter of 2017. A
9% rise in imports from Brazil to 15,300 MT was
sufficient to offset a 3% decline in imports from Indonesia
to 18,700 MT, and a 39% decline in imports from
Malaysia to 2,100 MT. (Chart 6).
Imports of tropical decking increased into France, were
stable into Germany and Belgium, but declined into the
Netherlands and UK in the first quarter of 2017.
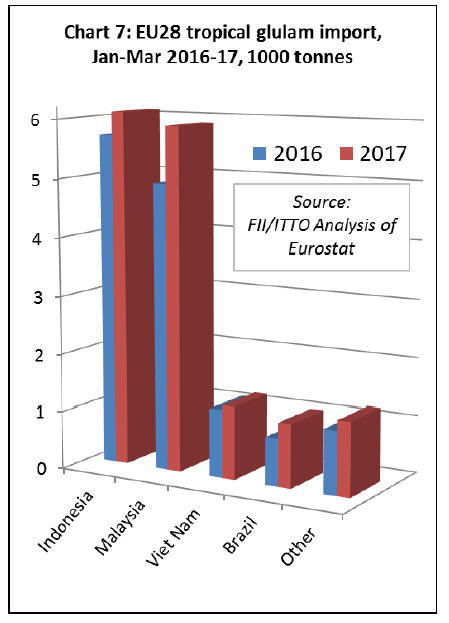
Rising EU imports of tropical glulam
EU imports of tropical glulam, mainly laminated window
scantlings, increased 14% to 15,600 MT in the first quarter
of 2017. Imports increased from both the leading
suppliers, rising 7% to 6,100 MT from Indonesia and 20%
to 5,900 MT from Malaysia. (Chart 6).
In the first quarter of 2017 EU imports of tropical glulam
increased into all the main EU markets for this
commodity, including the Netherlands, Belgium and
Germany.
Note that EU import data for the first quarter of 2017 for
tropical veneer, plywood, flooring, and wood furniture
will be included in the next market report.
Gradual recovery in EU construction forecast to
continue
Recovery of the European economy is boosting
construction output, although the overall growth rate is
forecast to remain slow in the next 2 years. These are the
main conclusions of the 83rd Euroconstruct Conference
hosted in Amsterdam on 8-9 June 2017.
Euroconstruct reported that European construction output
expanded by 2.5% in 2016, half a percentage point higher
than forecast at the previous Euroconstruct Conference
held in Barcelona in November 2016.
Euroconstruct now expect the volume of construction
output to increase by 2.9% this year and by 2.4% in 2018,
both above the previous projections in Barcelona (+2.1%
in 2017 and +2.2% in 2018).
The upgraded forecast reflects an economic upswing
stronger than expected half a year ago, greatly improved
consumer confidence and the continuing loose monetary
policy. Overall construction output is expected to increase
by 8% in 2016-2018 compared to the 6.5% forecast in
Barcelona. Thereafter growth is expected to moderate in
2019 (+2%), slightly below the Barcelona figure (+2.1%).
GDP growth of 1.5% to 2.0% per annum in the period
2017-2019 is projected for the 19 Euroconstruct countries.
According to Euroconstruct, the European economy is set
to follow a moderate growth path, stimulated by still
relatively low oil prices, the weaker euro exchange rate
and the Euopean Central BankˇŻs stimulus policy
(quantitative easing).
In most European countries, domestic consumer demand is
increasing, stimulated by declining unemployment.
Investment has started to pick up, particularly since
households and companies can still secure inexpensive
financing, and foreign demand is developing favourably.
However, the pace of recovery remains relatively
moderate due to the sluggish implementation of economic
reforms as well as long-standing weak growth trends. In
general, the European economic growth potential is lower
than it was before the financial crisis, due to the
population ageing and declining productivity growth.
Euroconstruct estimate that residential construction in
Europe expanded by 5% in 2016. In the coming years
growth in this market segment is projected to become less
strong, expanding by 3.7% in 2017, 2.3% in 2018 and
1.7% in 2019. At present, output in the sector is boosted
by demographic trends, increasing household income and
low mortgage rates.
New residential construction expanded by 8.8% in 2016,
and growth this year will also remain very strong (+6.8%).
However, a significant slowdown in new residential
construction is expected in 2018 and 2019. Growth in
residential renovation and maintenance has been slower
but is expected to remain consistent at about 1.5% per
year.
Non-residential construction is forecast to grow only
modestly in the coming years; by 2.3% in 2017, 1.8% in
2018 and 1.2% in 2019. Despite the positive impulse from
the growth of consumer demand and relatively high
corporate profits, expansion in this sector is hindered in
many countries by lack of external financing and the poor
financial situation of public authorities.
Subsectors where public financing is particularly
important ¨C such educational building ¨C is generally
lagging other sectors.
Output in civil engineering, after contracting 1.8% in
2016, is forecast to increase by 2% this year and by 3.6%
in both 2018 and 2019. Much growth in civil engineering
will be concentrated in Eastern Europe, largely due to a
new round of EU structural funds.
Construction activity in most European countries is
growing consistently at around 2% per year during the
2017-19 period. However, activity is forecast to grow
much more rapidly in a few countries, notably Hungary
(14.9%), Ireland (7.7%), Poland (5.5%), Czech Republic
(4.3%) and Portugal (4.1%).
|