|
Report from
North America
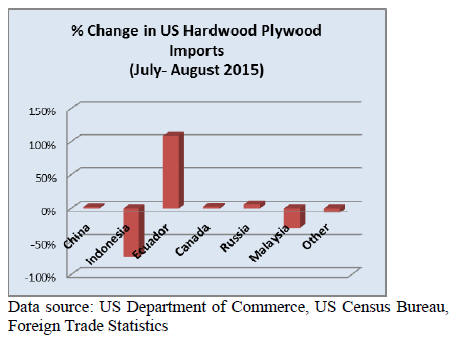
ChinaˇŻs plywood import share expands
US imports of hardwood plywood fell 17% from July to
August. A total of 262,180 cu.m. were imported. Year-todate
imports were still 6% higher than in August last year.
China increased its import share to 58% of total hardwood
plywood imports (149,326 cu.m.). Year-to-date imports
were up 13% from August 2014.
Plywood imports from Indonesia declined in August
(24,239 cu.m.) but year-to-date imports remain higher than
in 2014.
Malaysian plywood shipments to the US fell 30% monthover-
month to 5,443 cu.m. Year-to-date imports from
Malaysia were 8% below August 2014 levels.
Uruguay has become a significant supplier of hardwood
plywood to the US market. Year-to-date, the US imported
30,705 cu.m. from Uruguay in August, compared to
53,321 cu.m. from Malaysia.
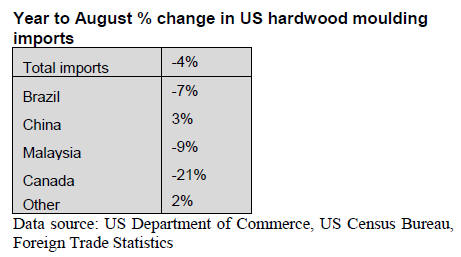
August moulding imports below 2014 levels
Year-to-date hardwood moulding imports were 4% lower
than at the same time last year, despite higher August
imports (US$19.5 million).
China was the only country to significantly increase
moulding shipments to the US in 2015. August imports
from China were worth US$7.6 million, up 15% from
July.
Moulding imports from Brazil increased by one third from
July to US$5.5 million. Imports from Malaysia declined
2% in August to US$1.1 million.
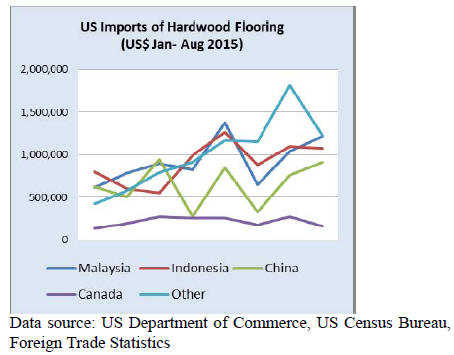
Malaysia and Indonesia dominate hardwood flooring
imports
Year-to-date imports of wood flooring (hardwood and
assembled panels) increased in August compared to the
same time last year.
Monthly imports of hardwood flooring declined slightly to
US$4.6 million in August, but year-to-date imports remain
up by almost one third from 2014.
All major suppliers benefitted from higher US demand,
but Malaysia and Indonesia showed the strongest growth
in year-to-date shipments to the US market. Malaysia was
the largest supplier of hardwood flooring in August at
US$1.2 million, up 16% from July.
Imports of assembled flooring panels increased 3% monthover-
month in August to US$12.9 million. China
accounted for about half (US$6.4 million) of all imports in
August.
Indonesia and Brazil each shipped just over US$0.5
million worth of assembled flooring panels to the US in
August. Year-to-date imports from both countries
increased significantly from last year.
Decline in furniture imports from China in August
The value of wooden furniture imported in August was
unchanged from the previous month at US$1.44 billion.
Year-to-date imports were 11% higher than in August
2014.
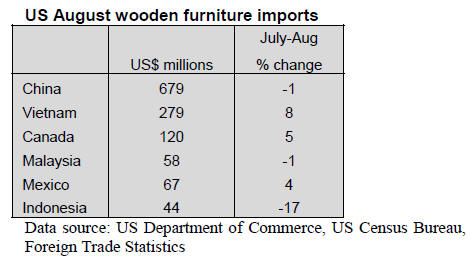
The share of various suppliers shifted slightly in August.
US wood furniture imports from China declined by 1% to
US$678.8 million or 47% of total imports.
VietnamˇŻs import share continued to grow. In August
Vietnam exported US$279.0 million of furniture the US,
accounting for 19% of total furniture imports.
Furniture imports from Malaysia and Indonesia fell in
August, but year-to-date imports were above 2014 levels.
Malaysia in particular increased exports to the US
compared to last year (+24%). Its share in total year-todate
imports grew from 3.8% to 4.2%.
Miscellaneous wooden furniture accounted for most
imports (US$494,040), followed by upholstered seating
(US$391,545) and bedroom furniture (US$298,965).
Federal Reserve expected to raise interest rates
The Federal Reserve is expected to raise interest rates in
December, following the release of positive economic
indicators in October. Job growth was higher than
expected, and unemployment fell to 5%, the lowest since
2008. Only the manufacturing sector showed no increase
in employment. Wage growth was higher than any other
time since the US recession. Some analysts already
speculate there could be a second rate hike in March 2016.
GDP growth was 1.5% in the third quarter of 2015,
according to the Department of CommerceˇŻs advance
estimate. In the second quarter real GDP increased 3.9%.
Personal spending increased in the third quarter, as well as
construction, exports and imports.
Manufacturing output expanded in October despite lower
employment in manufacturing, according to the Institute
for Supply Management. Furniture manufacturing
companies reported growth in production, while output
declined in the wood products sector in October.
Consumer and builder confidence highest in a decade
Consumer confidence rebounded in October, according to
the University of Michigan consumer sentiment index.
The gain was mainly among households with lower
incomes, while high income households were concerned
about financial markets.
The average level of the consumer sentiment index thus
far in 2015 was higher than any other year since 2004.
Builder confidence in the market for newly built, singlefamily
homes also grew in October. Confidence was the
highest since the end of the housing boom in 2005,
according to the National Association of Home Builders.
The main driver of the housing market recovery has been
the consistent growth in employment. The only downside
of an otherwise positive development is the strong growth
in service sector jobs, which usually pay lower wages than
manufacturing jobs.
Despite good demand for new homes, builders are
concerned about the supply side: the cost and availability
of labour and building lots, and the cost of building
materials.
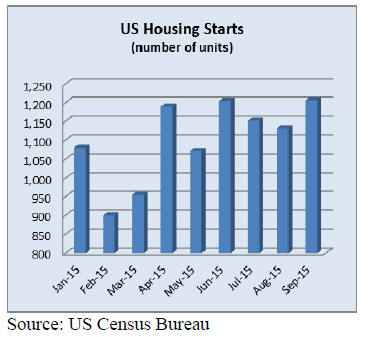
Housing starts over 1.2 million in September
Housing starts jumped in September to a seasonally
adjusted annual rate of over 1.2 million. Starts had been
over 1.1 million since June, according to US Census
Bureau data.
The growth was mainly in multi-family construction, but
single-family homes also increased slightly. In September
single-family homes accounted for 61% of total starts,
down from 65% to 67% earlier this year. Multi-family
starts increased 18% from August to September.
The National Home Builders Association expects a similar
pace of construction for the rest of 2015.
The number of building permits were at a seasonally
adjusted rate of 1.1 million in September, down 5% from
August. Much of the decline was in multi-family permits.
Higher home sales across the country
Sales of existing homes rebounded in September following
AugustˇŻs decline. Sales increased across the country,
according to the National Association of Realtors.
Home prices increased as well, but in some markets
affordability improved. Low mortgage rates continue to
support the housing market.
The number of homes on the market declined in
September, increasing inventory shortages. The share of
first-time buyers remains relatively low at less than one
third because of high home prices. Most home buyers
were current owners who sell their homes in these
favourable market conditions.
Consumer and business confidence down in Canada
Canadian housing starts grew to 231,304 in September at a
seasonally adjusted annual rate. It was the highest rate of
new construction since 2012. Low mortgage rates have
supported the housing market, despite a contraction due to
low oil prices.
Both single and multi-family construction increased in
September. Single-family homes accounted for just 25%
of total starts in September, compared to over 60% in the
US.
Foreign buyers might play a large role in the housing
market of CanadaˇŻs urban centres, but reliable data on
overseas home owners is lacking. According to the central
bank, the lack of data makes it more difficult to understand
risks to the financial system and housing market.
For 2016 the Canadian Housing and Mortgage
Corporation expects little change from this year. Housing
demand will decline in oil-producing provinces, but
construction is forecast to increase in British Columbia
and Ontario where manufacturing benefits from the lower
Canadian dollar.
|