|
Report from
North America
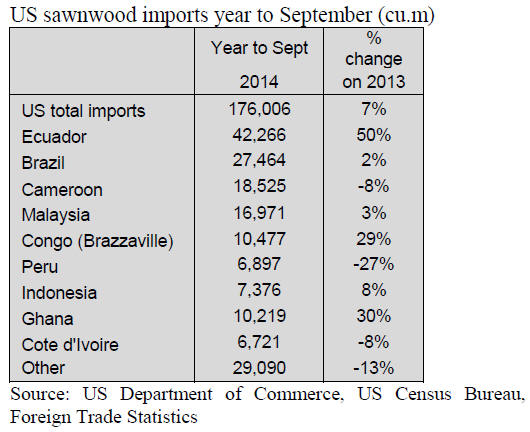
Lower US hardwood sawnwood imports
Compared to a month earlier US imports of hardwood
sawnwood fell by 8% in September to 99,254 cu.m.,
temperate hardwood imports were down 9%, while
tropical imports declined by 8% from August.
However, tropical imports at21,520 cu.m, were up 7%
year-to-date from September 2013.
Sawnwood imports of most tropical species declined in
September. Only imports of balsa, ipe and cedro grew.
Balsa imports from Ecuador were 5,463 cu.m., up 43%
year-to-date from 2013.
Ipe sawnwood imports increased by 19% from August to
2,754 cu.m. (+12% year-to-date). Cedro imports were
1,532 cu.m., up 25% year-to-date from September 2013.
Imports from Brazil declined in September despite higher
ipe shipments. Imports of virola, jatoba and other tropical
sawnwood were lower than in August.
Sawnwood imports from most other major suppliers also
fell from August. Only Ghana increased shipments to
1,665 cu.m. following lower volumes over the summer.
The increase was largely in cedro (933 cu.m.), while
sapelli imports declined.
Imports from Cameroon were down in September, both
year-to-date and compared to the previous month.
However, sapelli sawnwood imports from Cameroon
increased to 1,827 cu.m., while other species declined.
Malaysian shipments decreased by 11% month-overmonth,
but on a year-to-date basis they were 3% higher
than in September 2013. Malaysia exported 1,357 cu.m. of
keruing to the US in September.
Cameroon leads tropical sawnwood shipments to
Canada
The value of Canadian imports of tropical sawn hardwood
fell to US$2.4 million in September, down 22% from
August. The decline in September was mainly in imports
from Brazil, following exceptionally high import levels in
August. Year-to-date imports remain significantly higher
than in 2013 (+21%).
The largest source of Canadian imports was Cameroon at
US$692,425, followed by Ecuador and Brazil. Indonesia‟s
shipment declined slightly in September, but on a year-todate
basis Canada‟s imports from Indonesia have doubled
compared to the same time last year.
Sapelli imports increased to US$586,186, up 69% from
August. Virola, imbuia and balsa (combined) imports also
grew in September, while imports of mahogany, meranti
and other species declined from the previous month.
Plywood imports from Indonesia up in September
US imports of most manufactured wood products grew in
September despite the slow recovery in the housing
market and in non-residential construction. Both imports
and domestic production were significantly higher than in
September 2013. As the housing market continues to
expand, producers can look forward to even stronger US
demand.
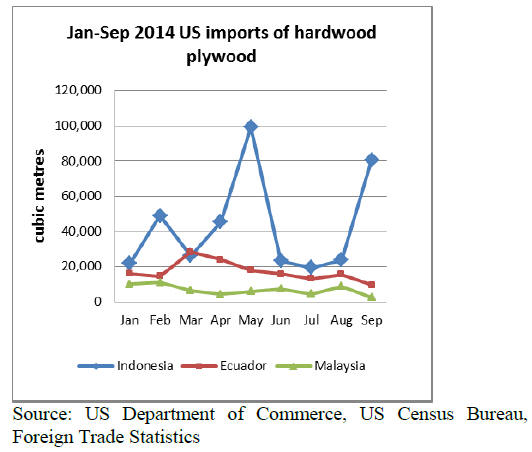
US imports of hardwood plywood grew in September
following a brief decline in August. Total imports were
265,066 cu.m., up 12% from August. Year-to-date imports
were 6% higher than at the same time last year.
The growth in imports was from Indonesia and Canada.
Imports from other countries declined in September.
Hardwood plywood imports from China fell by 11% to
119,568 cu.m.
Indonesian shipments of hardwood plywood more than
doubled in September to 80,774 cu.m. Imports from
Canada grew by 46% to 16,987 cu.m. Hardwood plywood
imports from Russia, Ecuador and Malaysia decreased in
September.
Higher hardwood moulding imports from Malaysia
Imports of hardwood moulding were steady from the
previous month at US$17.6 million in September. Year-todate
imports were 9% higher than in September 2013.
Hardwood moulding imports from Brazil and China fell,
while imports from Malaysia and Canada grew. China
remained the largest source of supply at US$5.7 million,
down 17% from the previous month.
Malaysian shipments of hardwood moulding were worth
US$1.4 million, up 35%. Year-to-date imports from
Malaysia were 16% higher than in September 2013. Both
hardwood flooring and assembled panel flooring up.
Hardwood flooring imports increased 9% in September
due to higher imports from Malaysia. Assembled flooring
panel imports grew by 10%, with only Brazil shipping less
than last month.
Imports of hardwood flooring were worth US$3.9 million
in September.
Imports from Malaysia more than doubled to US$1.1
million. Year-to-date imports from Malaysia were 18%
higher than in September last year.
Hardwood flooring imports from Indonesia declined (-
13%). China‟s shipments were almost unchanged from the
previous month, but significantly up from 2013.
In assembled flooring panels China maintained its lead in
the US market at US$5.9 million in September. However,
year-to-date imports were 10% lower than at the same
time last year. Imports from Canada and Indonesia
increased month-over-month in September, while Brazil
shipped less.
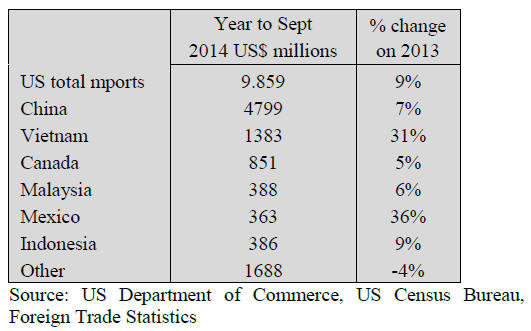
Vietnam and Mexico grow furniture import share
Wooden furniture imports grew by 1% in September after
declining in August. September imports were worth
US$1.27 billion. Year-to-date imports were 9% higher
than in September 2013.
Imports from most countries increased in September with
the exception of Mexico and Indonesia. Furniture imports
from China recovered from the decline in August and
grew 6% to US$605 million.
Vietnam‟s wooden furniture shipments increased 5% to
US$229 million. Year-to-date imports from Vietnam were
almost one third higher than in September last year.
Mexico also expanded its US import share in wooden
furniture in 2014. Year-to-date imports from Mexico were
36% higher in September than last year, despite a monthover-
month decline in September imports.
Furniture retail sales declined slightly in September (-2%),
which is not uncommon for this time of the year.
However, sales were 4% higher than in September 2013,
according to the US Census Bureau.
Higher US furniture manufacturing output
Economic activity in the US manufacturing sector grew in
October. The Institute for Supply Management‟s
manufacturing index increased by 2.4 percentage points
from the previous month.
Most companies report generally good business conditions
and growth in production and demand. Almost all
manufacturing industries reported growth in October,
including furniture manufacturing. Wood products
manufacturing companies reported no change in
production from September.
US consumer confidence up
Consumer confidence in the US improved 2.7% from
September to October according to the Thomson
Reuters/University of Michigan consumer sentiment
index. Consumer confidence was at its highest level in
October since July 2007.
Most households expect higher incomes and a stronger US
economy in the year ahead. Most consumers did not worry
about conflicts abroad or a slowdown in the global
economy.
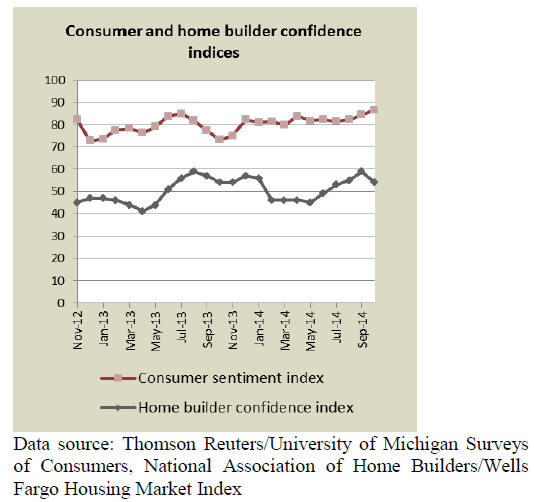
Despite higher consumer confidence, builders‟ confidence
in the market for newly built single-family homes declined
in October. Only in the US South builders were more
confident in market conditions than in September.
The National Association of Home Builders expects the
housing market to grow despite the lower reported
confidence. Conditions for home sales and new
construction are positive, including low mortgage rates
and higher employment
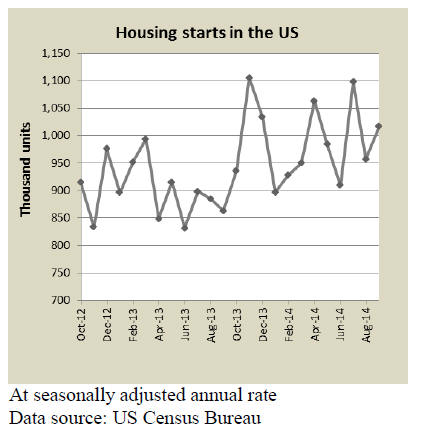
Higher housing starts across the country
Housing starts surpassed the 1 million mark for the third
time this year. Residential construction increased by 6.3%
in September at a seasonally adjusted annual rate. The
growth was mainly in multi-family construction, which
grew by 16.7%. Single-family housing starts increased by
1.1% to 646,000 units. Housing starts grew in all regions
of the country.
The number of building permits gained slightly to 1.018
million at a seasonally adjusted annual rate. Multi-family
permits increased, but permits for new single-family
homes declined. The number of building permits issued is
an indicator of future building activity.
Decline in Canadian housing starts
Non-residential construction spending was stable from
August to September at a seasonally adjusted annual rate.
Private construction decreased slightly (-0.6%) while
public construction grew. Public spending on office and
health care construction saw the greatest gain in
September.
The American Institute of Architects reports better
conditions for architecture firms in September. The most
positive outlook in the non-residential sector has been in
public institutional construction.
Sales of existing homes increased 2.4% in September
following a brief decline in August. Home prices were
5.6% higher than in September 2013. The share of firsttime
home buyers remains lower than average. Less than
one third of all existing homes were bought by first-time
buyers in the last 1.5 years.
Continued growth in office and commercial
construction
Non-residential construction spending decreased slightly
in August at a seasonally adjusted annual rate. Private
construction declined by 1.4% and public spending by
1.1%. However, the drop in public spending was mainly
in educational buildings. Public construction of office and
commercial buildings grew significantly by 11% and 8%,
respectively.
The American Institute of Architects reports a positive
outlook for the coming months.
* The market information above has been generously provided
by the Chinese Forest Products Index Mechanism (FPI)
|