|
Report
from
Europe
EU wooden furniture market
This analysis of EU wooden furniture supply draws on
production data from the Eurostat database of manufacturing
statistics and trade data from the Eurostat COMEXT database.
In line with Eurostat practice, all value data is reported in euros.
The data covers all types of wooden furniture with the exception
of kitchens. Kitchen furniture is excluded because it is supplied
almost exclusively by domestic manufacturers and is therefore
less relevant to overseas manufacturers.
In practice, the EU��s kitchen furniture industry has more in
common with the joinery sector than with other parts of the
furniture industry. Note that while all data is ultimately derived
from Eurostat, it has been subject to significant adjustment
during preparation of this report in an effort to remove
numerous inconsistencies.
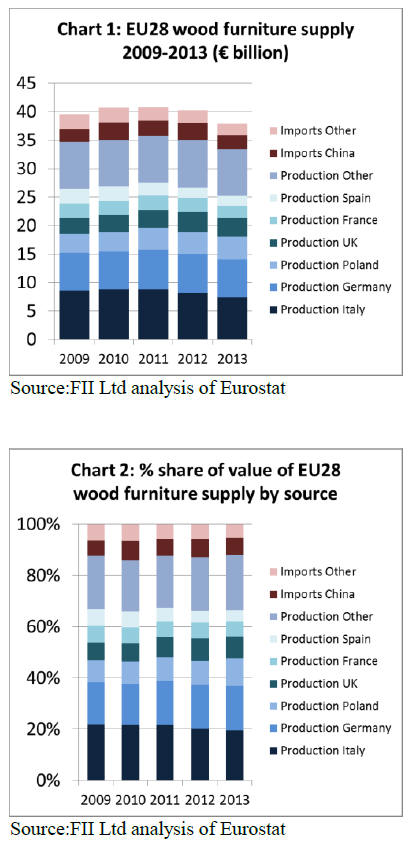
Total supply of wooden furniture into the EU28 market is
estimated to have been €37.9 billion in 2013, down 6%
from €40.3 billion in 2012 (Chart 1). EU28 wooden
furniture production decreased 4% from €46.45 billion to
€45.22 billion between 2012 and 2013.
Imports decreased 13% from €5.2 billion to €4.5 billion
during the same period. In 2013, imports accounted for
12% of wooden furniture supply to the EU, down from
13% the previous year and the peak level of 14% recorded
in 2010 (Chart 2). Overall consumption is estimated to
have fallen 8% in 2013 from €32.7 billion to €30.0 billion
(Chart 3).
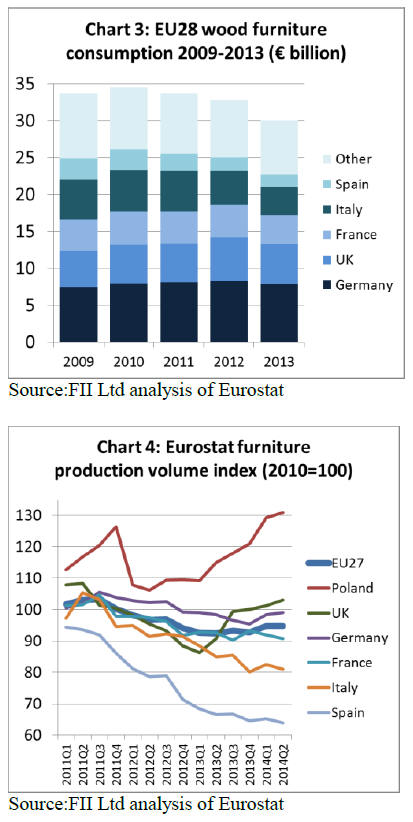
The Eurostat wooden furniture production index suggests
that the downward trend in EU furniture manufacturing
has levelled off in 2014 (Chart 4). Production has risen
sharply in Poland and the UK since the middle of last year.
After sliding in 2013, production in Germany, Italy and
France stabilised in the first half of 2014. However
production has continued to slide in Spain this year.
Italian wooden furniture production down 8% in 2013
The value of wooden furniture production in Italy is
estimated to have fallen 8% to €7.45 billion in 2013,
continuing the decline of the previous two years. Italian
manufacturers recorded a 1% decrease in export market
sales during 2013, from €4.27 billion to €4.21 billion.
��
Continuing weakness in the Italian domestic furniture
market led to a sharp 9% decline in imports from €702
million to €636 million. Overall wooden furniture
consumption in Italy is estimated to have fallen 15% from
€4.57 billion to €3.88 billion during 2013.
After a year of relative stability in 2012, the German
wooden furniture market declined in 2013. German
wooden furniture production is estimated to have fallen by
5% from €6.91 billion in 2012 to €6.57 billion in 2013,
mainly due to a 6% decrease in domestic market
consumption from €8.27 billion to €7.81 billion in 2013.
Between 2012 and 2013, German wooden furniture
exports decreased 14% from €2.65 billion to €2.28 billion,
while imports decreased 12% from €4.01 billion to €3.52
billion.
Meanwhile Poland, a country which has seen significant
inward investment in furniture production capacity in
recent years, recorded a 7% increase in production value
from €3.81 billion in 2012 to €4.01 billion in 2013. This
reverses a slight decline the previous year.
The rise in production was mainly due to growth in the
local market. Poland‟s domestic consumption of wooden
furniture increased 30% to reach €936 million in 2013, the
highest level for four years.
Poland‟s wooden furniture exports remained stable at
around $3.35 billion in both 2012 and 2013.
Euro value of UK wooden furniture consumption down
8% in 2013
In terms of € value, UK consumption of wooden furniture
recorded an 8% fall from €5.94 billion in 2012 to €5.49
billion in 2013. UK production declined 10% from €3.54
billion in 2012 to €3.18 billion in 2013.
UK exports of wooden furniture decreased 4% from €331
million in 2012 to €318 million in 2013. The value of UK
wooden furniture imports fell 4% from €2.74 billion in
2012 to €2.63 billion in 2013.
These negative numbers for the euro value of consumption
and production in the UK need to be considered in the
light of exchange rate fluctuations. The GBP was on
average around 10% weaker against the euro in 2013
compared to 2012. This depresses the € value of UK
production and trade in 2013 relative to 2012.
The UK government‟s own Index of Production for UK
furniture suggests production measured in GBP fell to a
low in February 2013 but then increased consistently for
the next 18 months.
After a slow year in 2012, French wooden furniture
consumption suffered a further 11% decline to €3.90
billion in 2013. French products also came under
increasing competitive pressure in export markets. Exports
of wooden furniture from France decreased 3% from €688
million in 2012 to €669 million in 2013.
Overall, French wooden furniture production fell 7% from
€2.44 billion in 2012 to 2.27 billion in 2013. Imports of
wooden furniture into France decreased 13% to €2.30
billion in 2013.
Catastrophic collapse of Spanish furniture sector
continues
The catastrophic collapse of Spain‟s wooden furniture
sector continued during 2013. Production fell a further 7%
from €1.83 billion to only €1.70 billion. Concerted efforts
to boost overseas sales led to a 5% increase in exports
from €515 million in 2012 to €541 million in 2013. This
follows a 3% rise in exports the previous year.
However this could not offset a 13% decrease in Spanish
wooden furniture consumption from €1.90 billion in 2012
to €1.64 billion in 2013. Spain‟s imports of wooden
furniture declined 16% from €579 million in 2012 to €485
million in 2013.
In contrast to Spain, wooden furniture production in
Portugal has rebounded quite strongly. Production in
Portugal increased 42% to €682 million between 2011 and
2012, and then gained a further 2% to reach €697 million
in 2013. Portugal‟s domestic market has remained very
weak. Imports into the country fell 16% to €123 million,
while total consumption was down 19% at €294 million in
2013. However, Portugal‟s wooden furniture exports
increased 13% to €527 million in 2013.
Dutch wooden furniture market falls sharply
In the Netherlands, wooden furniture consumption fell
16% to €1.024 billion in 2013. Production in the country
fell 12% to €649 million while imports were down 20% at
€782 million. Weaker demand in neighbouring EU
countries also led to a 19% decline in Dutch wooden
furniture exports to €408 million in 2013.
Wooden furniture consumption and trade were also much
weaker in Belgium last year. Consumption in the country
declined 10% to €811 million, production was down 5% at
€631 million and imports fell 13% to €841 million.
Exports from Belgium were €520 million in 2013, 16%
less than the previous year.
Rise in Romanian wooden furniture production
Wooden furniture production continued to rise in a
number of Eastern European countries during 2013.
Romania is the second largest manufacturer of wooden
furniture in Eastern Europe after Poland. Wooden
furniture production in the country increased 4% to €1.05
billion in 2014.
Romanian exports of wooden furniture were €783 million
in 2013, little changed from the previous year. After a
steep decline in 2012, domestic consumption of wooden
furniture in Romania increased 10% to €382 million in
2013.
However the Romanian furniture sector may face
challenging times ahead. Romania‟s economy is
weakening and there are reports of shortages of wood for
furniture manufacture in the country.
Wooden furniture production in Lithuania increased 3%
from €766 million in 2012 to €788 million, the vast
majority of this being exported. The value of wooden
furniture production in Lithuania has increased by around
65% in the last five years. Following recent investment,
Lithuania is now the fifth largest supplier of products to
the furniture giant IKEA.
Elsewhere in Eastern European during 2013, wooden
furniture production increased 7% to €442 million in
Slovakia and was stable in Czech Republic (€337 million),
Estonia (€224 million), Hungary (€287 million), and
Slovenia (€163 million). Wooden furniture production in
Croatia was €133 million in 2013, a 30% decline
compared to the previous year.
EU wooden furniture imports recover some ground in
2014
Imports of wooden furniture into the EU from outside the
region declined 13% from €5.27 billion in 2012 to €4.53
billion last year. However, the falling trend in imports in
2013 has reversed in 2014. In the first 6 months of 2014,
the EU imported €2.45 billion of wood furniture, 3% more
than the same period in 2013.
These trends are broadly in line with those across the EU
market for wooden furniture which declined in 2013 but is
showing signs of recovery this year.
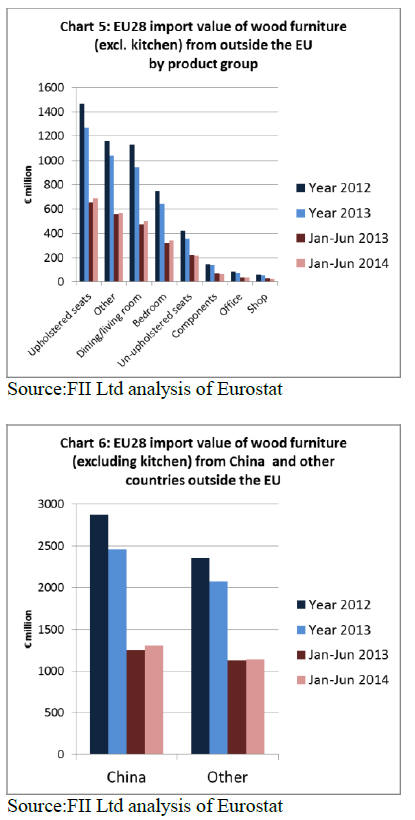
EU import performance has varied widely by product
group this year (Chart 5). During the first 6 months of
2014, there was a rise in imports of upholstered seats
(+5%), dining/living room furniture (+6%) and of
bedroom furniture (+5%).
However there was a decline in imports of un-upholstered
seats (-2%). EU imports of wooden furniture components
and of shop and office furniture �C which already account
for only a tiny share of the market - were also declining.
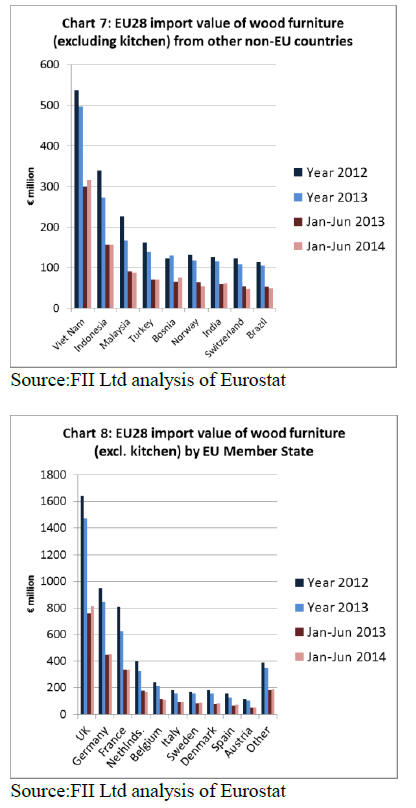
After falling 14% to €2.46 billion in 2013, EU imports of
wooden furniture from China were €1.31 billion in the
first 6 months of 2014, 5% more than the same period in
2014 (Chart 6). EU imports of wooden furniture from
Vietnam were also up 6% at €316 million in the first half
of 2014 (Chart 7). But imports declined from Indonesia (-
1% to €157 million) and Malaysia (-4% to €87 million)
during the 6 month period.
In the first six months of 2014, imports of wooden
furniture from non-EU countries increased into the UK
(+7% to €813 million), Germany (+1% to €452 million),
Italy (+2% to €91 million), Sweden (+4% to €85 million),
Denmark (+4% to €83 million) and Spain (+14% to 70
million).
Imports from non-EU countries have fallen into France (-
1% to €334 million), Netherlands (-4% to €169 million)
and Belgium (-4% to €111 million).
|